BI-systems (Business Intelligence), or systems with "business intelligence" - analytics systems that combine data from various sources of information, transform them, and present them in a visual form convenient for analysis.
BI technologies make it possible to process large unstructured volumes of data for making business decisions by company management.
BI technologies make it possible to process large unstructured volumes of data for making business decisions by company management.
What is the Power BI?
Power BI is a set of Microsoft software services that work together to turn a company's disparate data sources into cohesive, interactive reports. In this case, the source can be databases, Excel files, data from cloud sources and the Internet, text files, and so on.
What is the Loyalty Culture?
The Loyalty Culture platform is a marketing and customer loyalty management system. This is a virtual marketer who performs up to 80% of routine work.
Based on the Loyalty Culture platform, you can use the Power BI system and have a powerful tool for a marketer with cool functionality.
But what if the conversation is not about customer loyalty management, but, for example, about the sales department, where analytics is of a different kind, but reporting has not gone away.
And here we are ready to help. Business Culture implements Power BI reporting projects for a variety of business areas and not only for those who use Loyalty Culture.
Analytical dashboards* (data control panels) can be implemented for any customer requests for any business areas (sales, finance, logistics, marketing, procurement, supply and other areas).
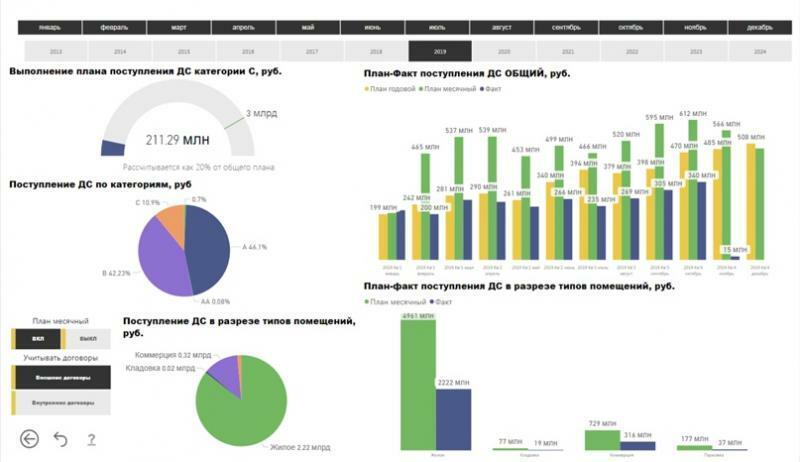
Consider an example of implementing analytical dashboards in Power BI for a real estate sales department.
Plan-fact analysis of sales
Visualization of current work results and the ability to select any period of interest using the top report control panel.

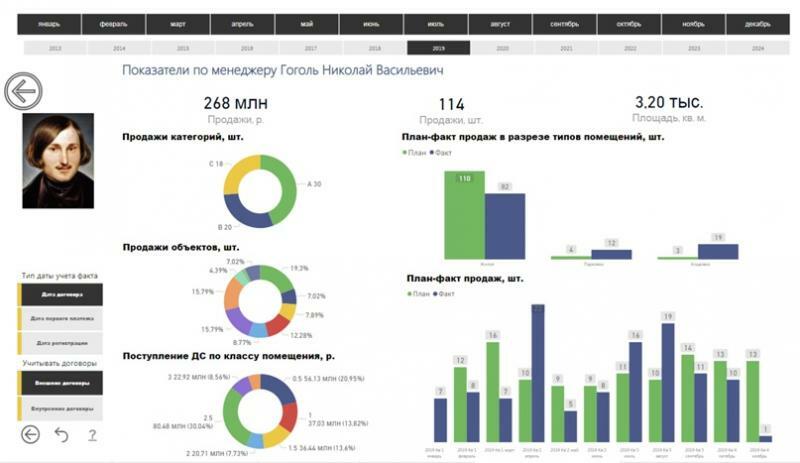
Sales manager report
The key piece of information for any sales manager (CEO) is how effective their sales manager is.
You can correctly configure and track the quality of work by almost any indicator of interest.
In this example, for a quick and effective assessment of labor, such indicators were used as: periods, transaction volumes (planned / actual), cash receipts for different classes of premises, sales by categories of premises and areas.

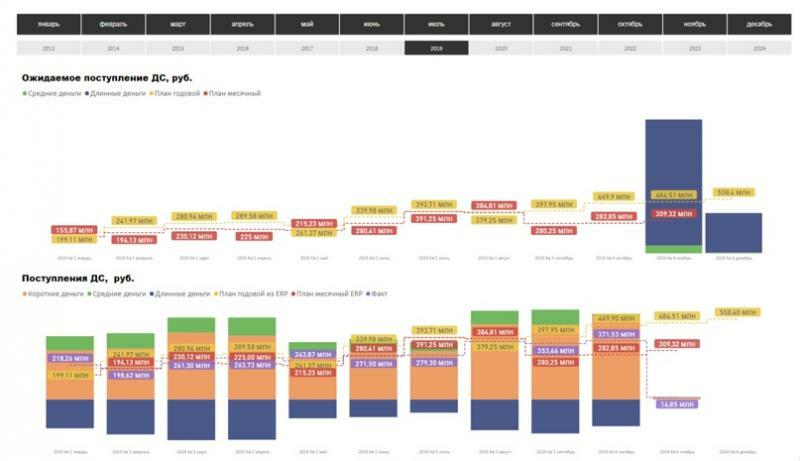
Assessment of current financial flows
Here, perhaps, the most important information for owners, general and financial directors is how financially efficient the company is.
Visual intuitive charts are a simple and easy way to understand where the business is heading and what to prepare for.
Visual intuitive charts are a simple and easy way to understand where the business is heading and what to prepare for.

Visualization of reports can be completely different and we are always ready to help you and your business in developing individual solutions, taking into account your wishes and specifics of work.
Leave a request at office@loycult.com or call +7 (495) 12-88-901, +7 (3412) 901-907 and we will be happy to tell you more about the possibilities of Power BI.
Leave a request at office@loycult.com or call +7 (495) 12-88-901, +7 (3412) 901-907 and we will be happy to tell you more about the possibilities of Power BI.


